Our number-one priority to ensure that our delegators receive the highest possible rewards at all times, is to successfully mint and propagate every block.
For this reason, the most of our time is spent on monitoring and finetuning the performance of our servers. After all, for a Stake Pool Operator, what is the point of for example having a phenomenal social media presence, when missing valuable blocks and rewards at the same time?
Curious to see if our time and efforts are spent in the right way, we looked at how many of our minted blocks were orphaned (i.e. not successfully added to the chain), and we compared the outcome with the results of the most popular (largest) pools out there.
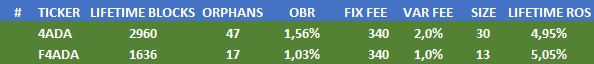
As per the above data, 4ADA produced 2960 reward-generating blocks, and 47 rejected, aka “orphaned” blocks, resulting in a Orphaned Block Ratio (OBR) of 47/(47+2960) = 1.56%. F4ADA saw 1.03% of its blocks rejected by the network.
To see how 4ADA and F4ADA measure up against other pools, we retrieved the same data for 50 of the largest pools. More specifically, on pooltool.io we applied the following selection criteria and included the 50 first pools from the list:
- Include pools with at least 1000 produced blocks;
- Sort by size (Active Stake, shown in Millions of ADA);
- Exclude pools with 100% variable fee;
- In case of multi-pool operators, include only the largest one.
We added 4ADA and F4ADA to the resulting list of 50 pools and ranked all 52 by Orphaned Block Ratio, lowest OBR (=better) ranked highest.
Only the ticker names of the pools performing better than 4ADA or F4ADA are shown in the tables. And to save ourselves some work we did not look up the pool parameters of the bottom half.
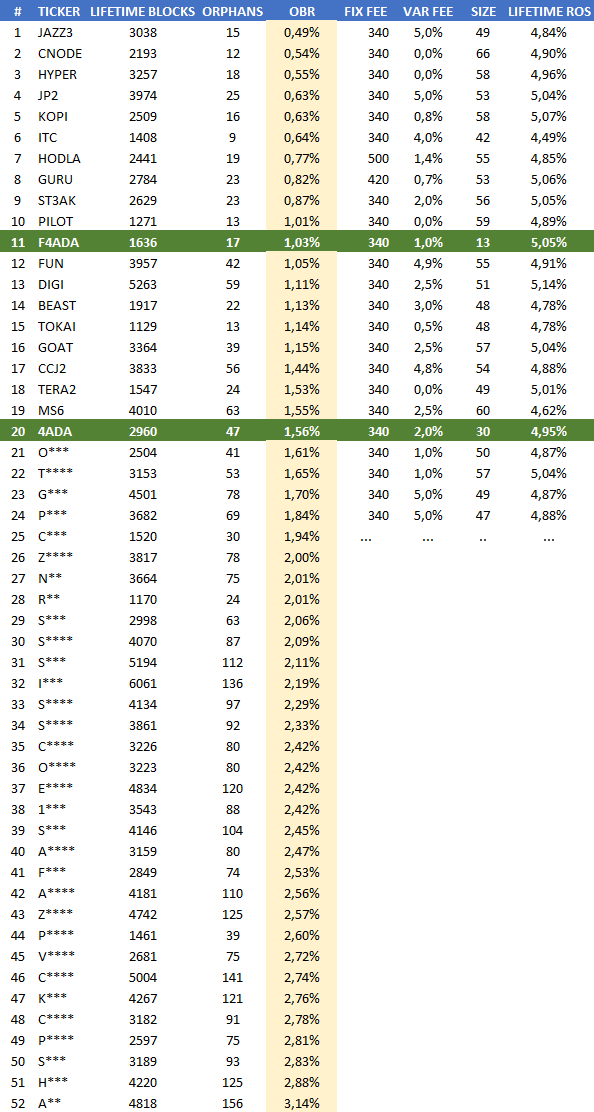
4ADA and F4ADA have similar or better block propagation performance than most large pools
What this means is that 4ADA and F4ADA are just as capable -or even better- at successfully getting it added to the chain and collect the corresponding block rewards, than our biggest competitors are.
What the Orphaned Block Ratio doesn’t say is in how many cases pools completely failed to produce a block at a given time even though it was assigned to produce one. This data cannot be compared, since every pool’s assigned block production schedule (slot leadership) is unknown to the public; only each pool knows when it is tasked to produce its own blocks.
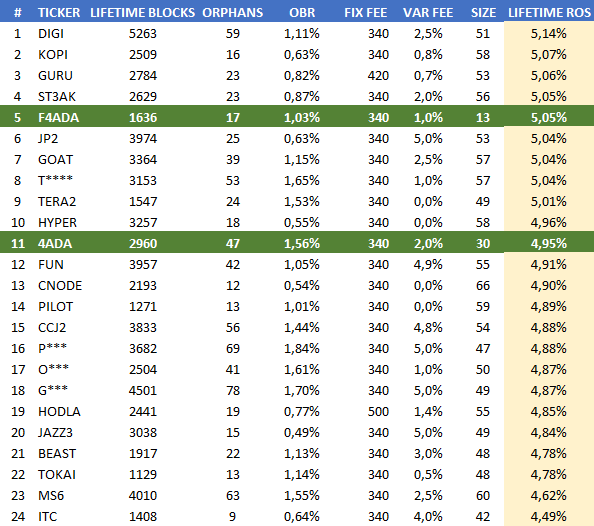
Wanting to know how the OBR impacts overall pool performance, we also looked at Lifetime ROS, since this is probably the leading performance indicator for many delegators. In the ranking below we ignored the pools from the bottom half in the previous chart, for which we were too lazy to look up all pool parameters.
Conclusion
4ADA and F4ADA can easily keep up with the biggest pools out there:
- Percentage-wise, 4ADA and F4ADA are better at successfully adding freshly minted blocks to the chain than most of the 50 largest competing pools.
- Even in terms of overall ROS performance, 4ADA and F4ADA are just as -if not more- attractive than most of our strongest competitors, despite their bigger size.
Thanks for reading! Feel free to use this information to your best advantage. If you have any questions or comments, please leave a comment below.
Happy staking!☀️
Leave A Comment